NSC 6-Year Completion Rate Analysis for VPCC
Table 1, 6-Year Completion Rate Over the Last 10 Years
| Term | Total Cohort | Completion Rate at VPCC | National Benchmark |
| Fall 2017 | 907 | 30% | 33% |
| Fall 2016 | 1000 | 31% | 32% |
| Fall 2015 | 1040 | 28% | 31% |
| Fall 2014 | 1102 | 25% | 29% |
| Fall 2013 | 1196 | 30% | 30% |
| Fall 2012 | 1062 | 25% | 28% |
| Fall 2011 | 1119 | 24% | 26% |
| Fall 2010 | 1755 | 23% | 27% |
| Fall 2009 | 1765 | 24% | 26% |
| Fall 2008 | 1600 | 24% | 26% |
Figure 1, 6-Year Completion Rate Over the Last 10 Years
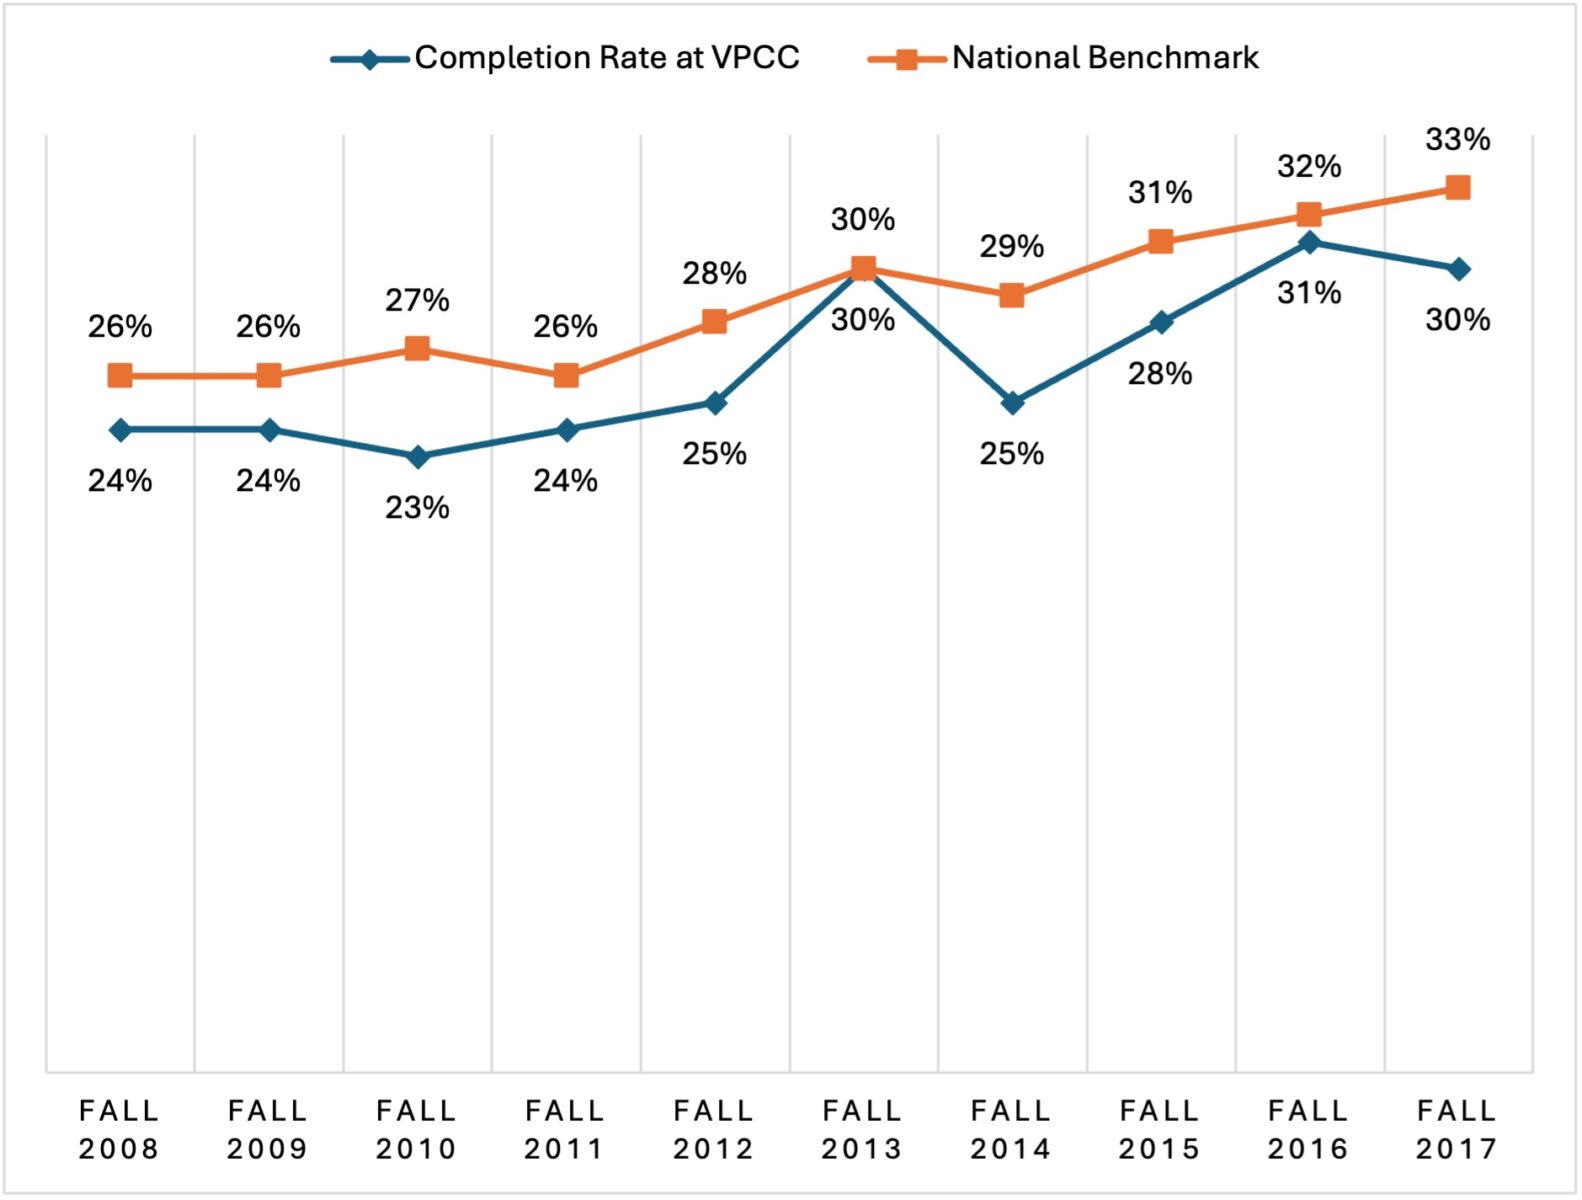
Table 2, 6-Year Completion Rate by Gender Over the Last 10 Years
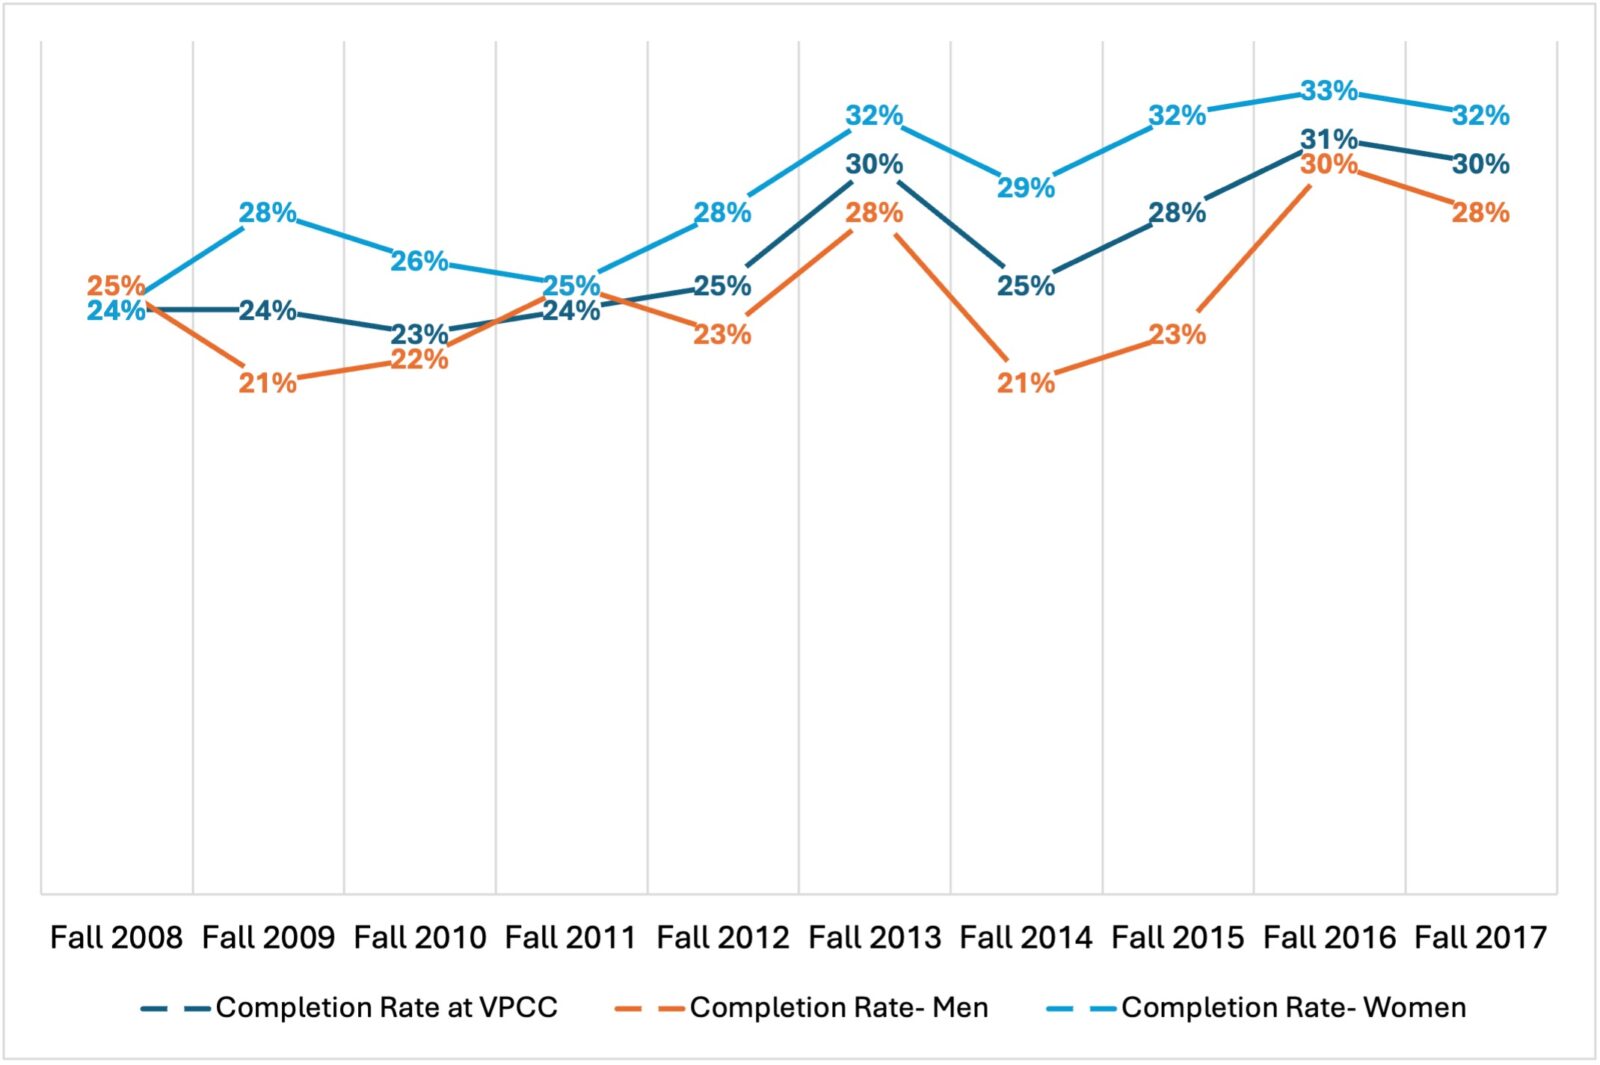
Figure 3, 6-Year Completion Rate for Women Over the Last 10 Years
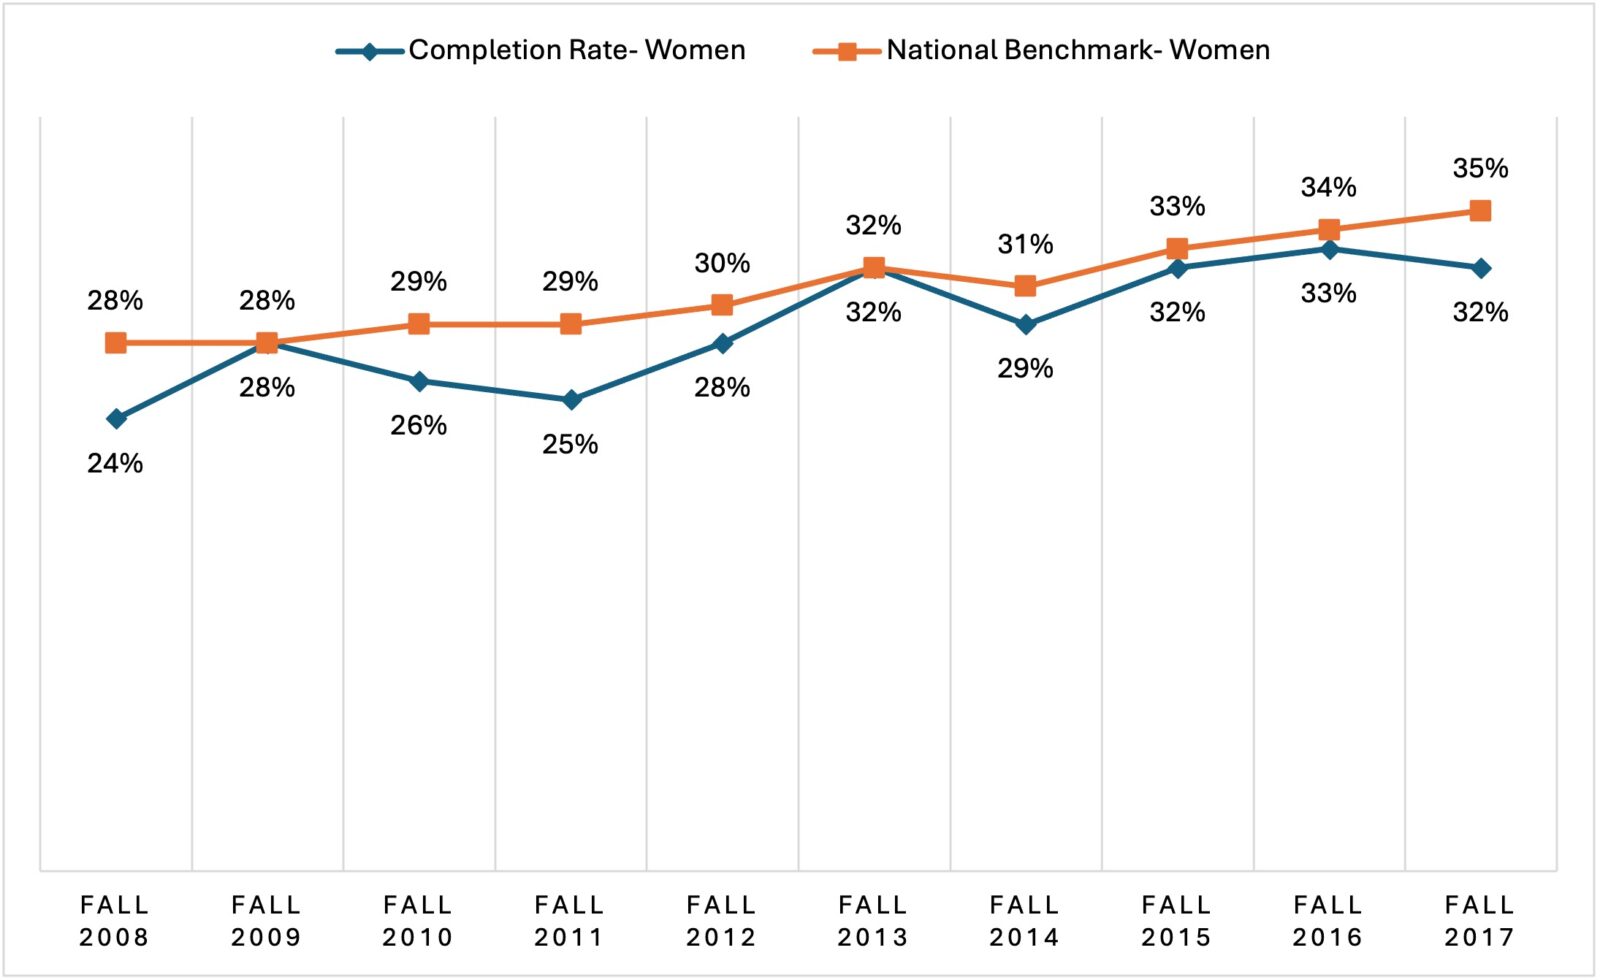
Figure 4, 6-Year Completion Rate for Men Over the Last 10 Years
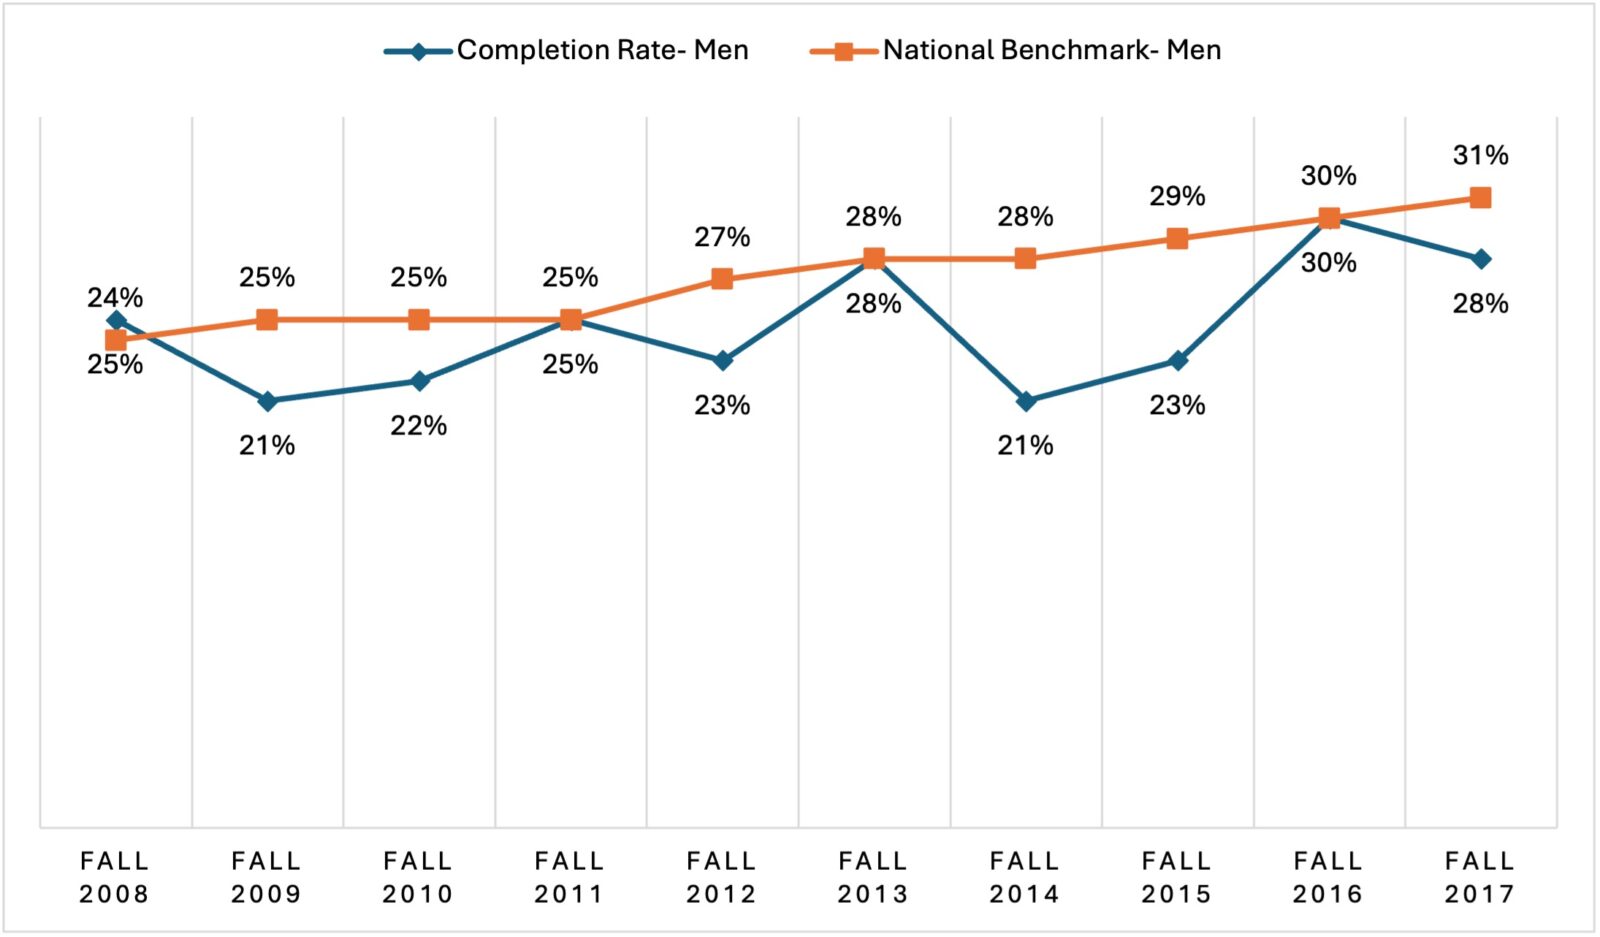
Table 3, 6-Year Completion Rate by Age Over the Last 10 Years
| Term | Total Cohort | 20 and younger | Completion Rate | National Benchmark |
| Fall 2017 | 907 | 742 | 32% | 33% |
| Fall 2016 | 1000 | 815 | 32% | 32% |
| Fall 2015 | 1040 | 837 | 29% | 31% |
| Fall 2014 | 1102 | 767 | 27% | 31% |
| Fall 2013 | 1196 | 805 | 32% | 30% |
| Fall 2012 | 1062 | 675 | 26% | 29% |
| Fall 2011 | 1119 | 750 | 27% | 27% |
| Fall 2010 | 1755 | 1082 | 25% | 27% |
| Fall 2009 | 1765 | 1148 | 23% | 25% |
| Fall 2008 | 1600 | 1075 | 22% | 26% |
| Term | 21-24 | Completion Rate | National Benchmark | >24 | Completion Rate | National Benchmark |
| Fall 2017 | 77 | 18% | 27% | 89 | 30% | 35% |
| Fall 2016 | 87 | 25% | 28% | 97 | 28% | 34% |
| Fall 2015 | 70 | 29% | 25% | 132 | 18% | 32% |
| Fall 2014 | 140 | 19% | 23% | 192 | 24% | 30% |
| Fall 2013 | 161 | 32% | 24% | 224 | 23% | 30% |
| Fall 2012 | 156 | 24% | 21% | 228 | 24% | 29% |
| Fall 2011 | 150 | 14% | 19% | 218 | 19% | 28% |
| Fall 2010 | 174 | 17% | 19% | 499 | 23% | 30% |
| Fall 2009 | 175 | 17% | 18% | 442 | 27% | 30% |
| Fall 2008 | 156 | 13% | 20% | 369 | 33% | 30% |
Figure 5, 6-Year Completion Rate by Age Over the Last 10 Years
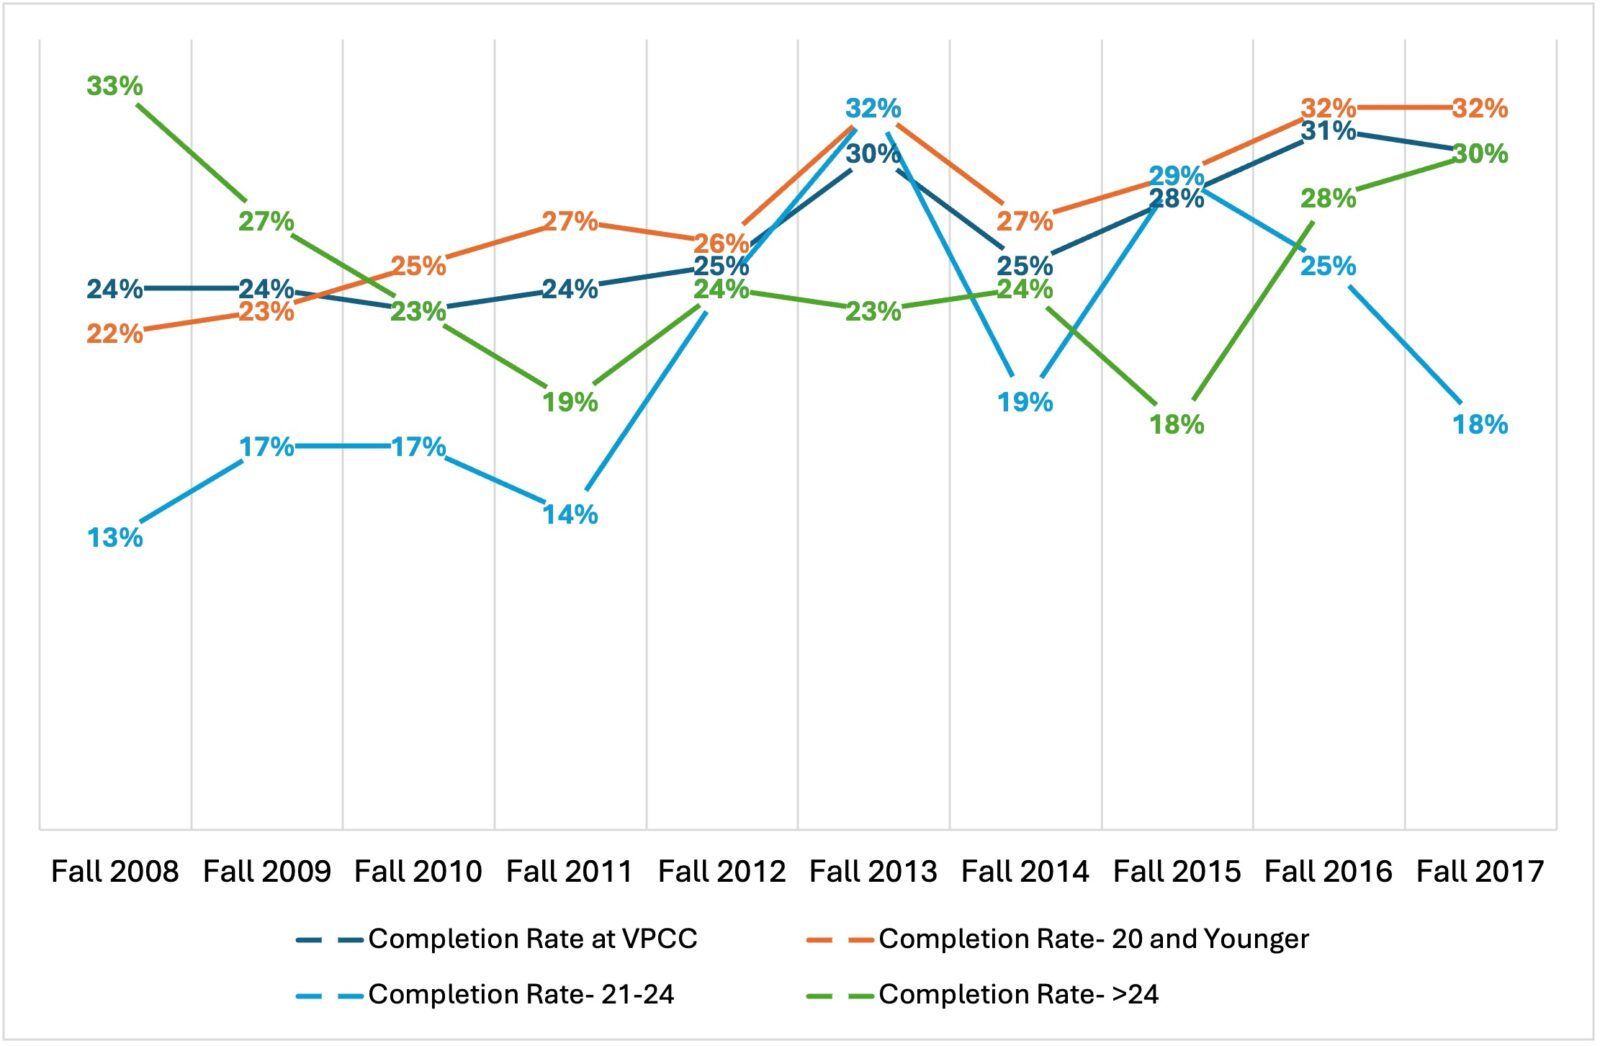
Figure 6, 6-Year Completion Rate for Students 20 Years or Younger Over the Last 10 Years
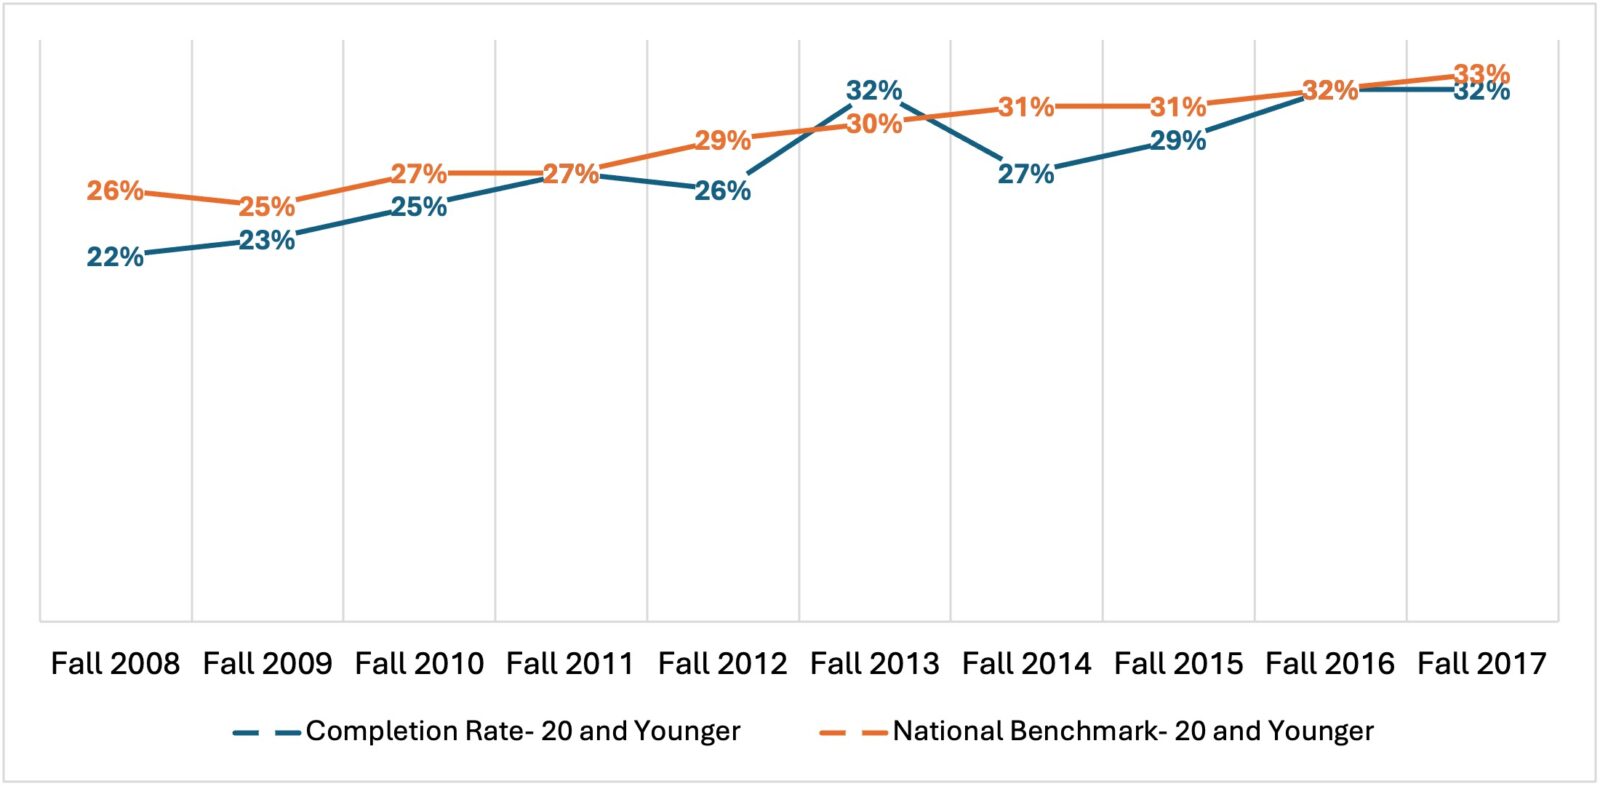
Figure 7, 6-Year Completion Rate of Students Between 21-24 Years Old Over the Last 10 Years
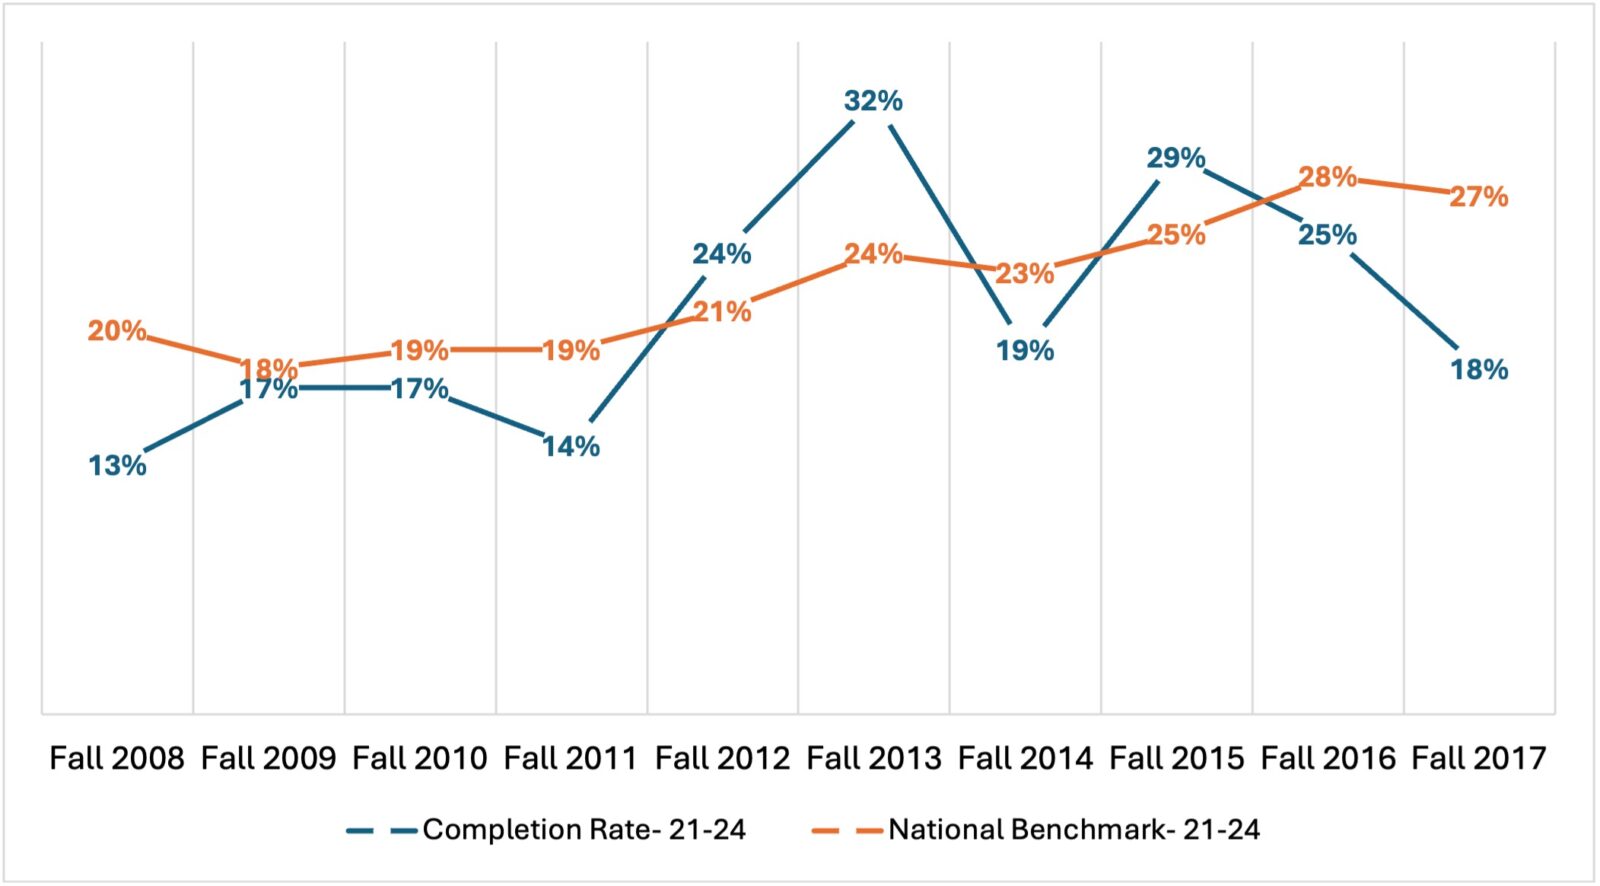
Figure 8, 6-Year Completion Rate of Students Between Older than 24 Over the Last 10 Years
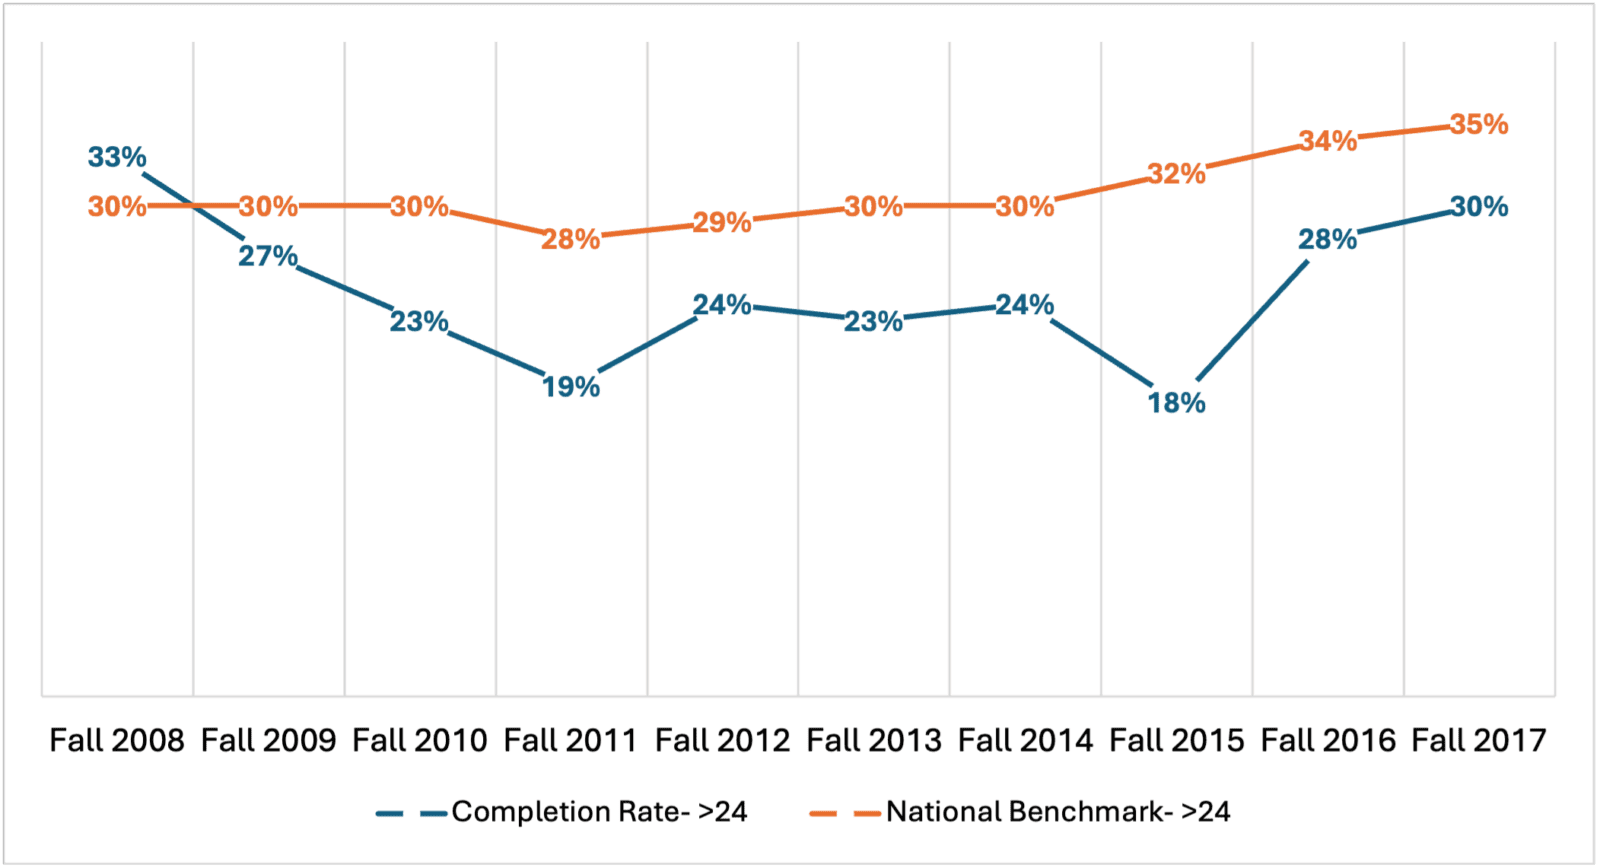
Table 4, 6-Year Completion Rates by Race/Ethnicity Over the Last 7 Years
| Term | Total Cohort | Asian | Completion Rate | National Benchmark | Black | Completion Rate | National Benchmark |
| Fall 2017 | 907 | 27 | 44% | 37% | 246 | 17% | 24% |
| Fall 2016 | 1000 | 44 | 48% | 36% | 263 | 21% | 23% |
| Fall 2015 | 1040 | 29 | 21% | 34% | 307 | 22% | 22% |
| Fall 2014 | 1102 | 24 | 38% | 33% | 385 | 15% | 20% |
| Fall 2013 | 1196 | 39 | 36% | 32% | 395 | 21% | 21% |
| Fall 2012 | 1062 | 31 | 42% | 31% | 347 | 16% | 19% |
| Fall 2011 | 1119 | 19 | 58% | 29% | 286 | 16% | 18% |
| Term | Hispanic | Completion Rate | National Benchmark | White | Completion Rate | National Benchmark |
| Fall 2017 | 100 | 37% | 30% | 427 | 36% | 38% |
| Fall 2016 | 106 | 33% | 29% | 493 | 38% | 37% |
| Fall 2015 | 35 | 20% | 28% | 538 | 32% | 36% |
| Fall 2014 | 30 | 27% | 27% | 505 | 33% | 35% |
| Fall 2013 | 23 | 26% | 28% | 601 | 36% | 35% |
| Fall 2012 | 22 | 5% | 26% | 521 | 33% | 34% |
| Fall 2011 | 23 | 17% | 25% | 459 | 36% | 33% |
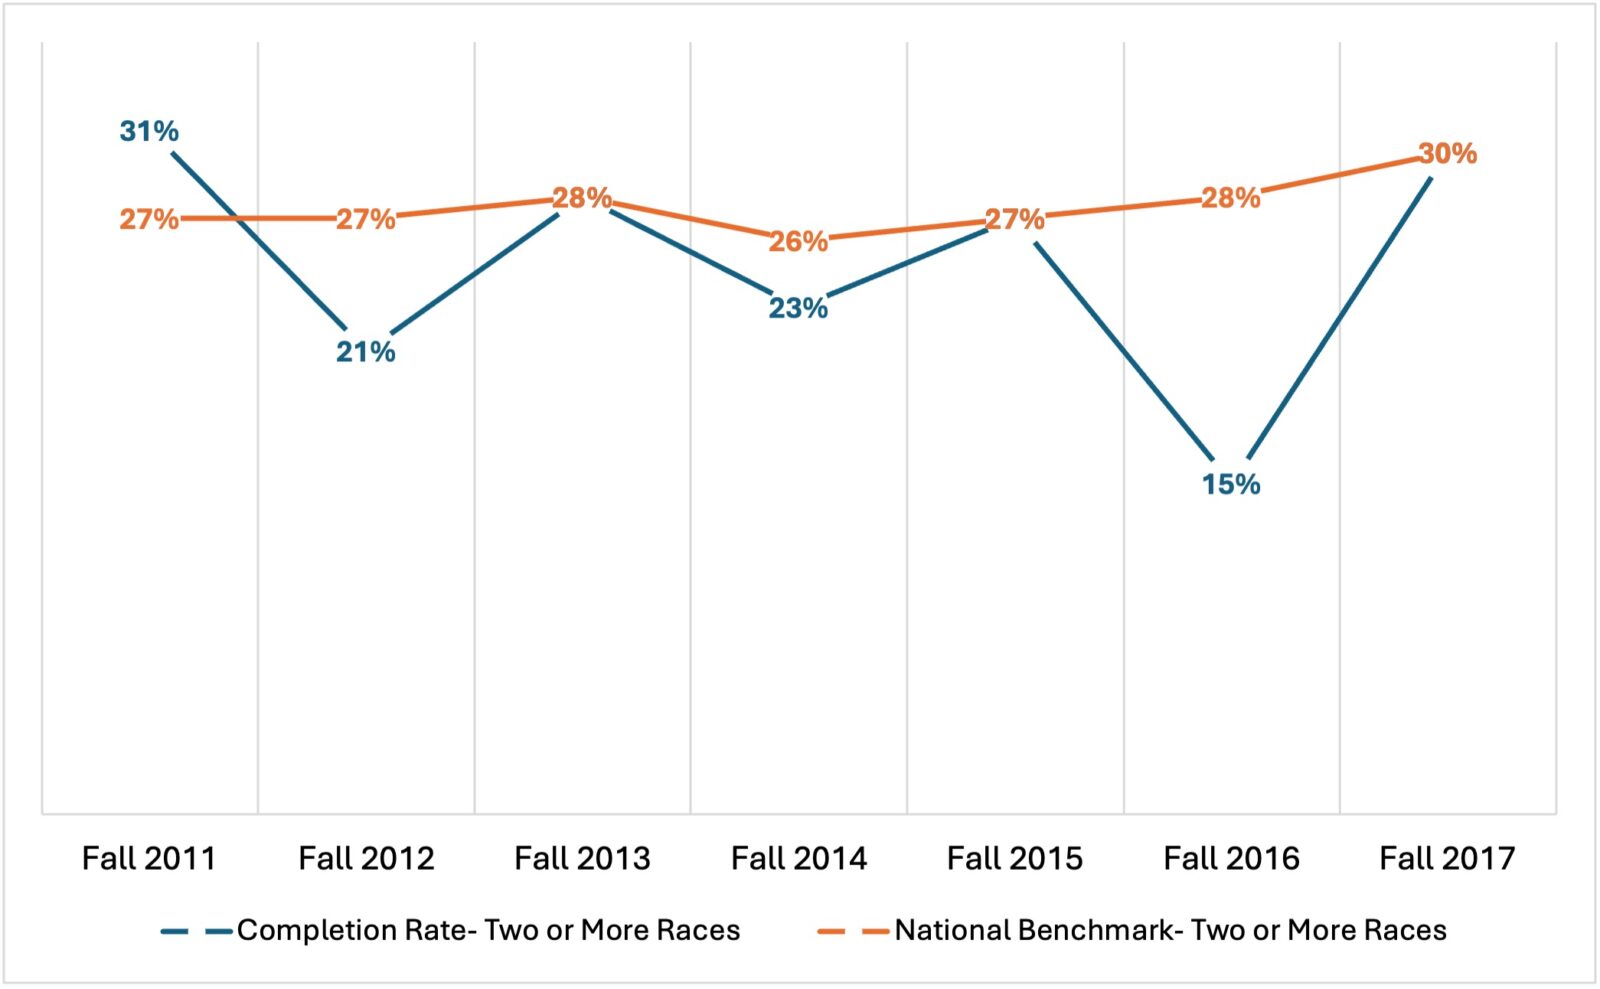
| Term | Other | Completion Rate | National Benchmark | 2 or More | Completion Rate | National Benchmark |
| Fall 2017 | 13 | 23% | 33% | 91 | 30% | 30% |
| Fall 2016 | 5 | 0% | 33% | 80 | 15% | 28% |
| Fall 2015 | 8 | 38% | 30% | 122 | 27% | 27% |
| Fall 2014 | 9 | 33% | 30% | 145 | 23% | 26% |
| Fall 2013 | 12 | 33% | 31% | 119 | 28% | 28% |
| Fall 2012 | 12 | 41% | 28% | 92 | 21% | 27% |
| Fall 2011 | 15 | 21% | 26% | 87 | 31% | 27% |
Figure 9, 6-Year Completion Rate of Students by Race/Ethnicity Over the Last 7 Years
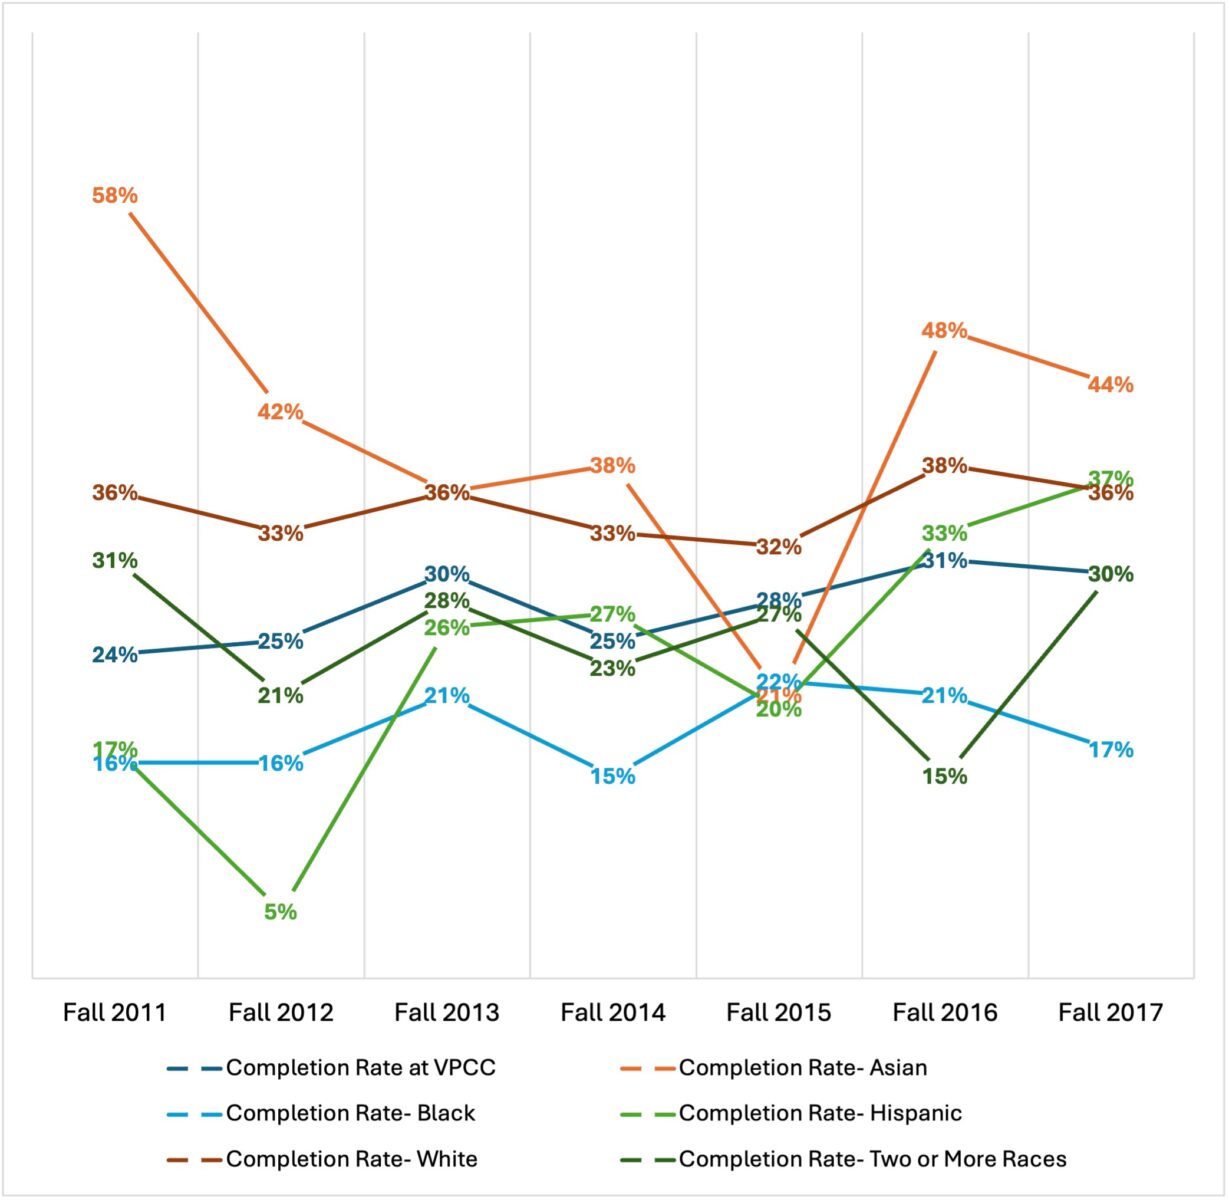
Figure 10, 6-Year Completion Rate for Students Identifying as Asian Over the Last 7 Years
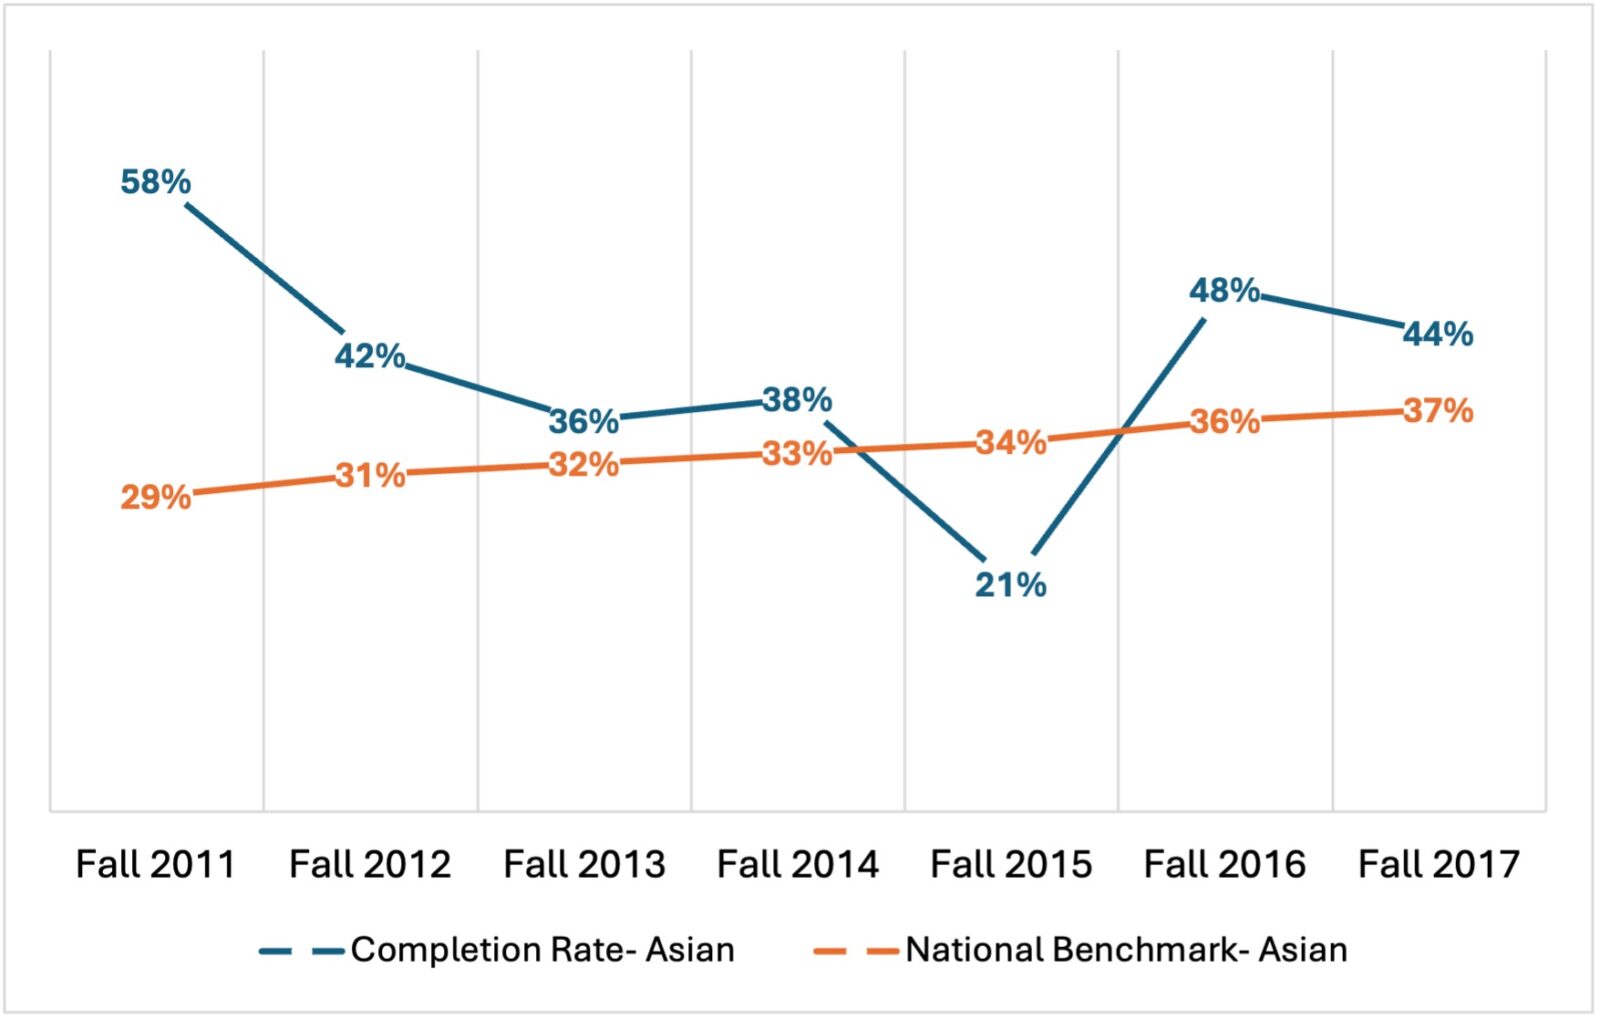
Figure 11, 6-Year Completion Rate for Students Identifying as Black or African American Over the Last 7 Years
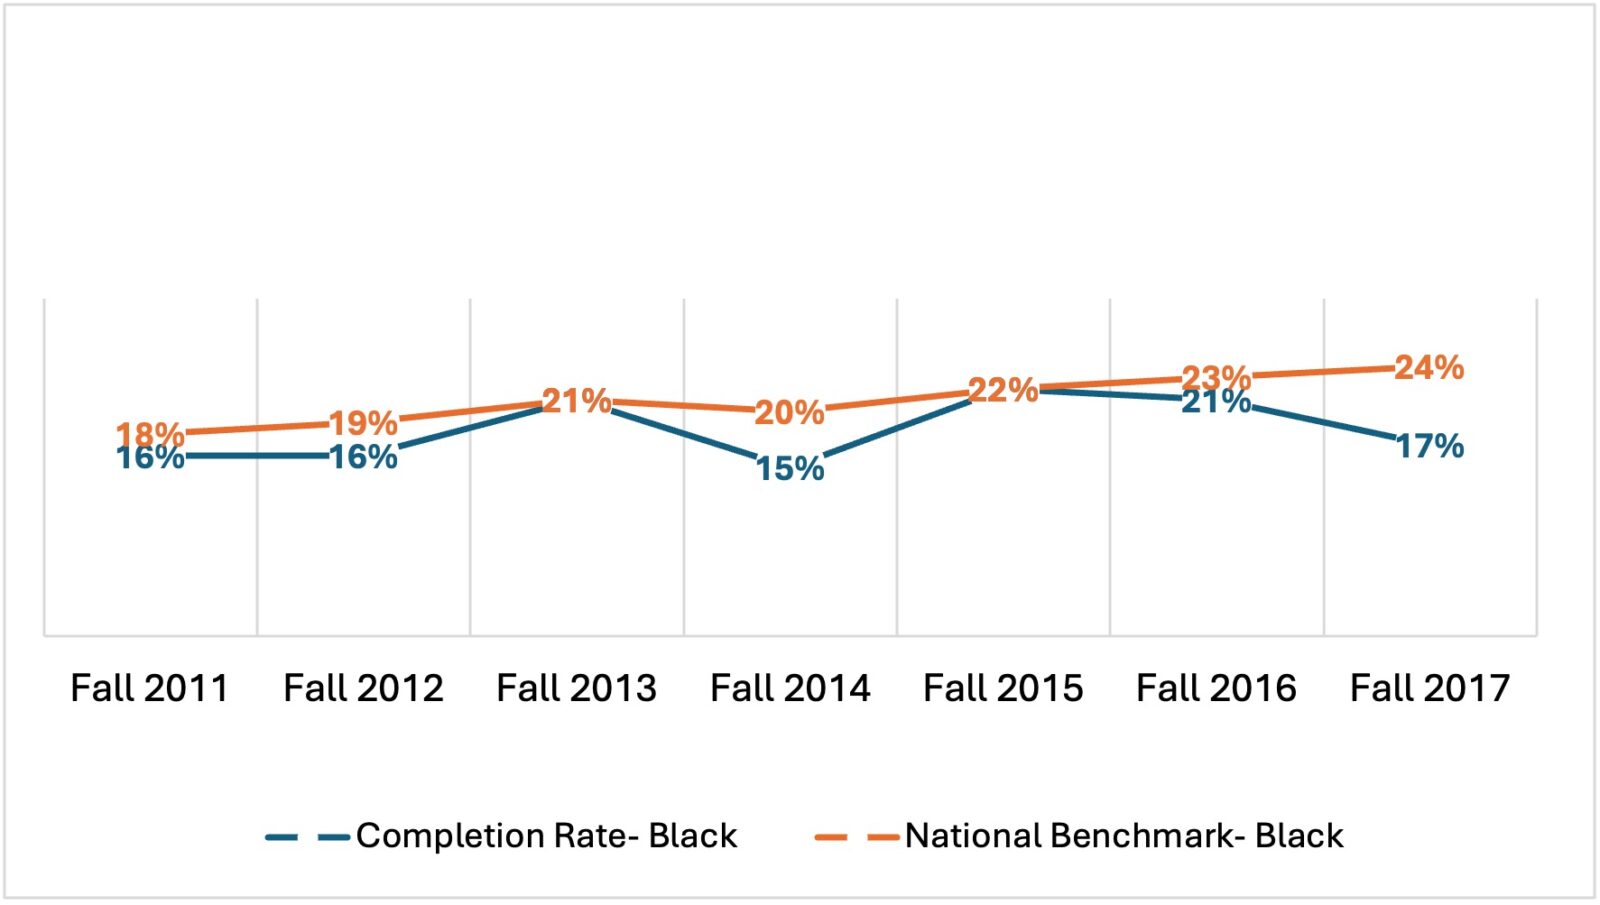
Figure 12, 6-Year Completion Rate for Students Identifying as Hispanic or Latina Over the Last 7 Years
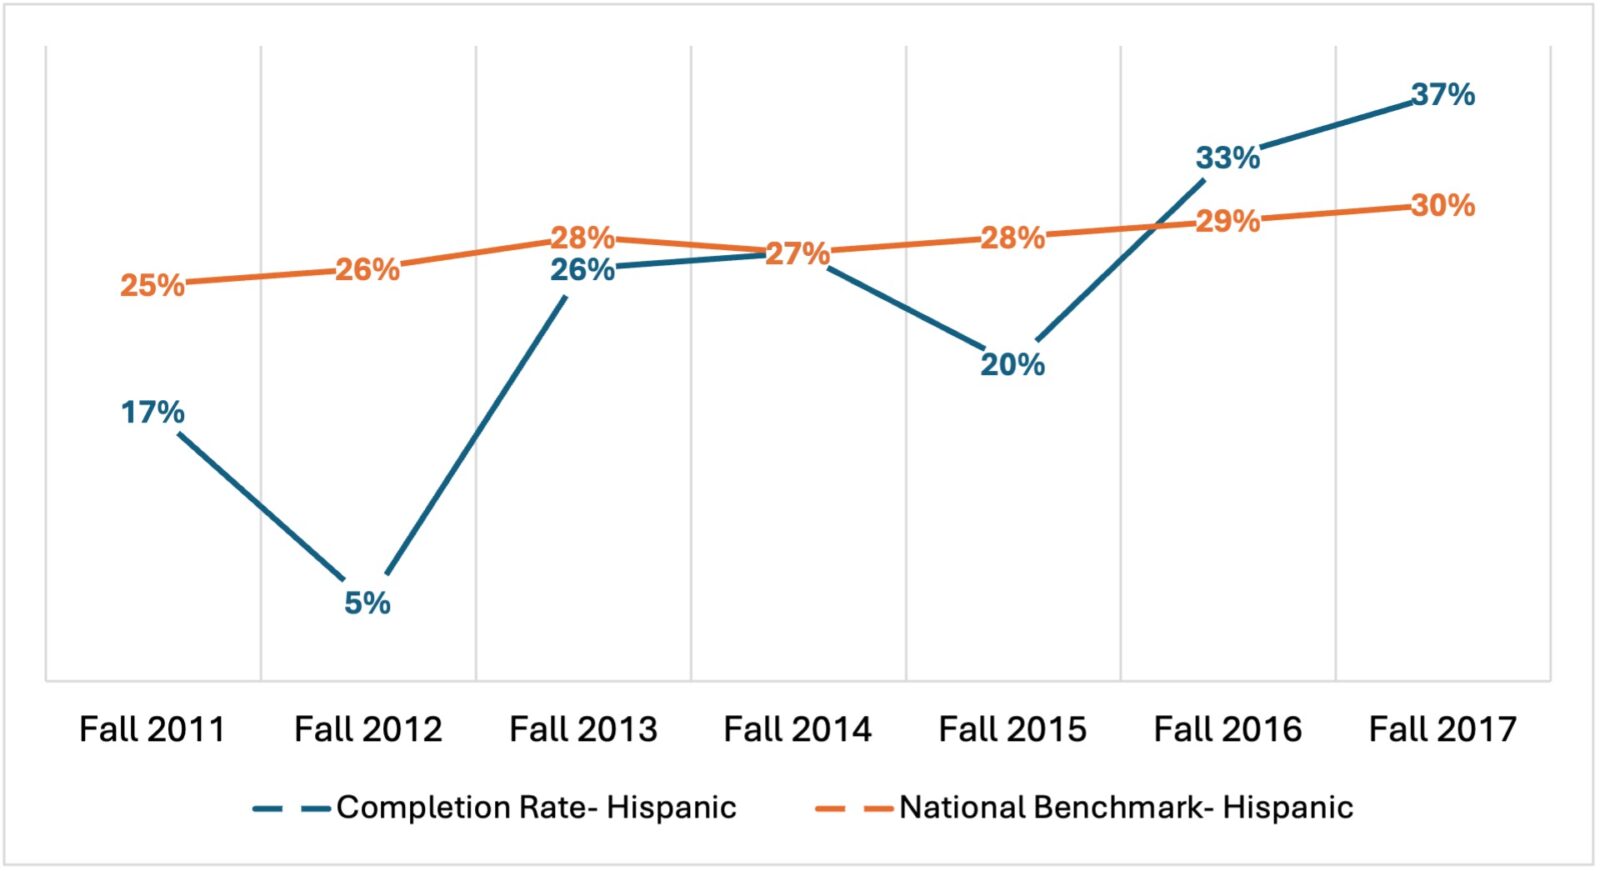
Figure 13, 6-Year Completion Rate for Students Identifying as White Over the Last 7 Years
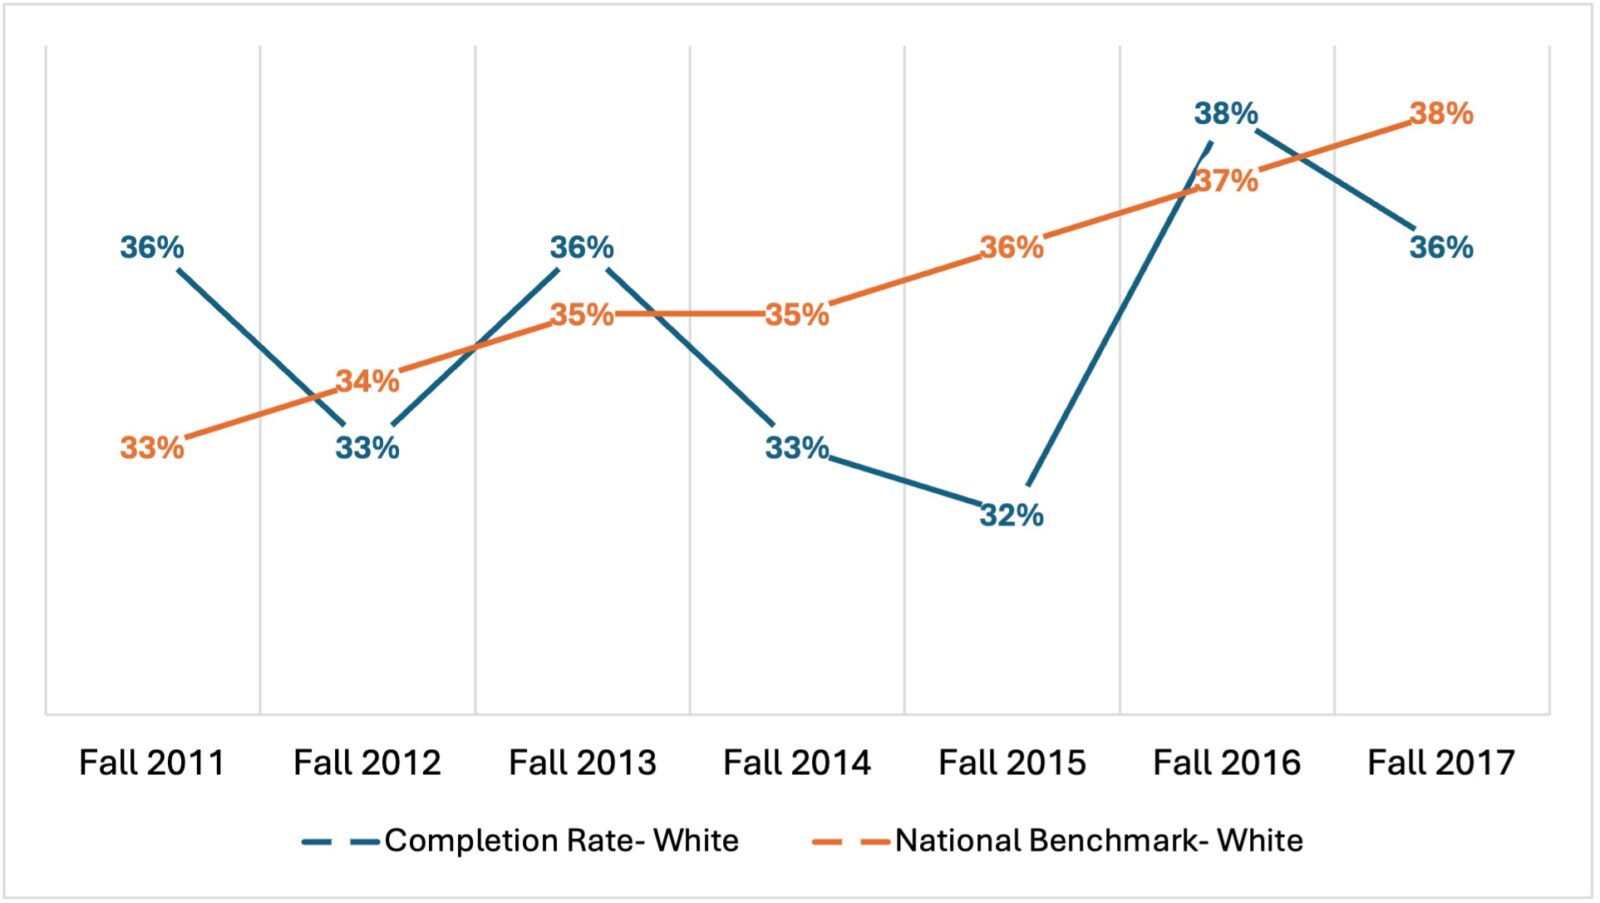
Figure 14, 6-Year Completion Rate for Students Identifying as Another Race of Ethnicity Over the Last 7 Years
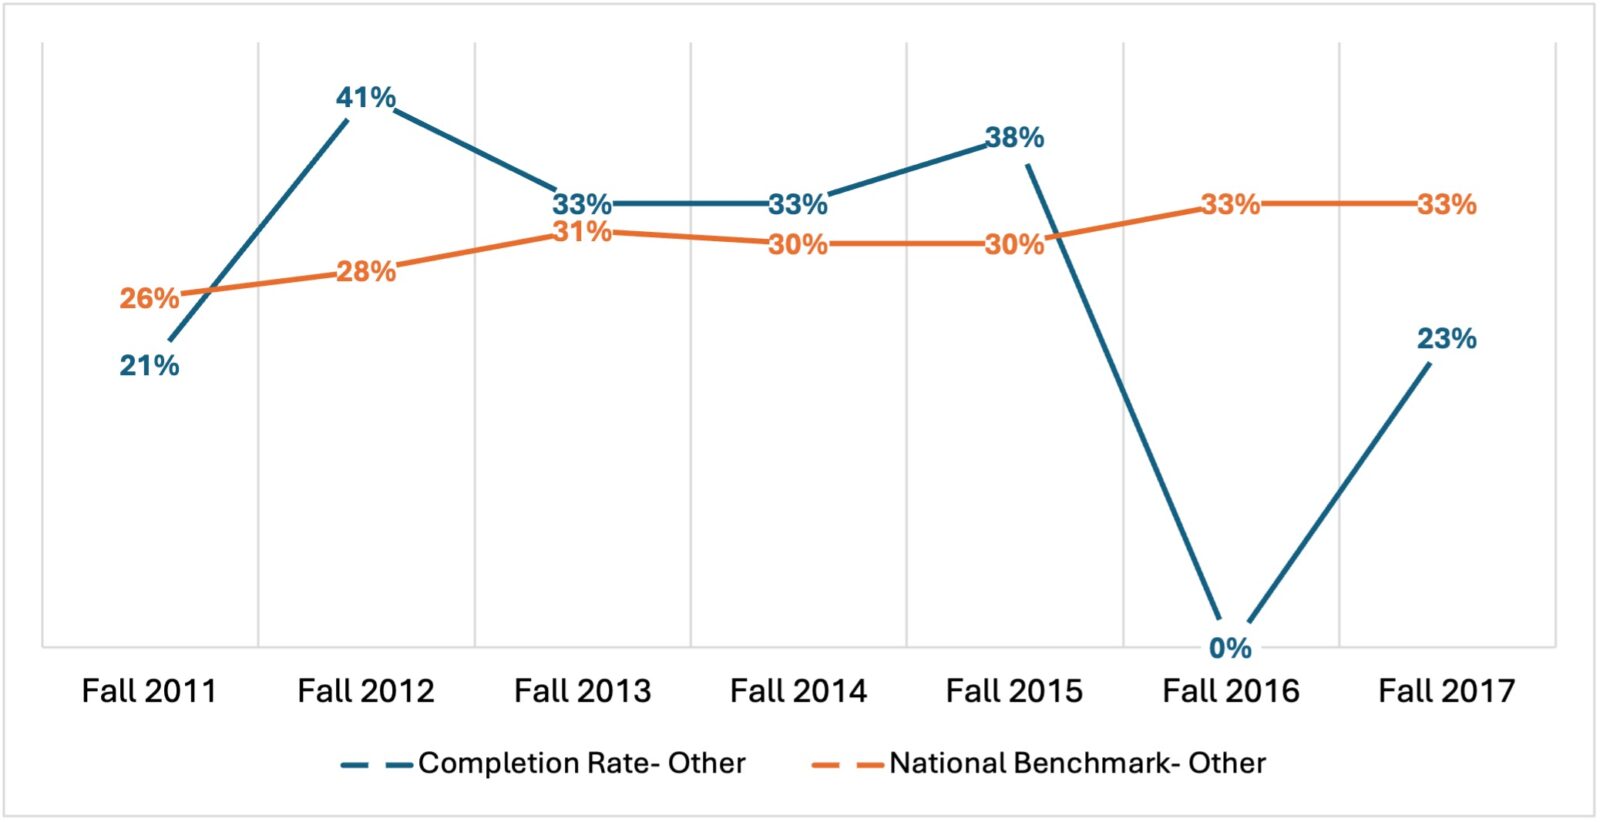
Figure 15, 6-Year Completion Rate for Students Identifying as More Than 1 Race or Ethnicity Over the Last 7 Years